
主题
坐标轴
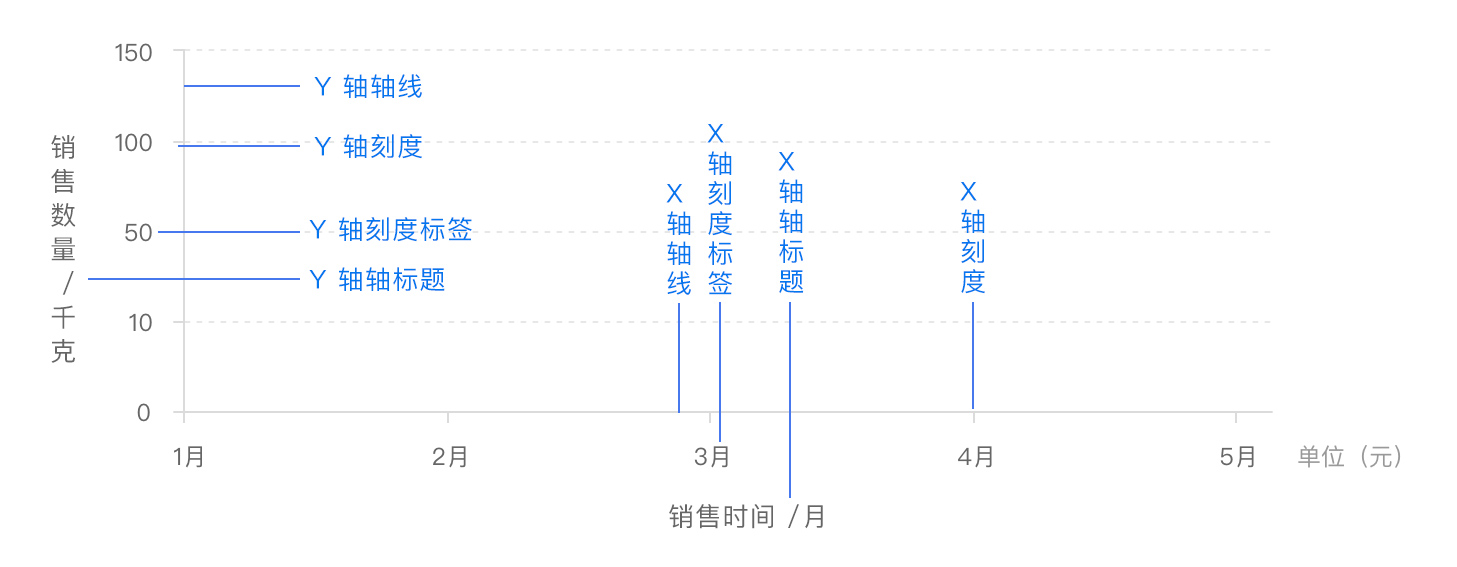
x 轴和 y 轴都由轴线、刻度、刻度标签、轴标题四个部分组成。部分图表中还会有网格线来帮助查看和计算数据。
示例
js
option = {
  legend: {},
  tooltip: {},
  dataset: {
    source: [
      ['月份', '降水量'],
      ['1月', 6],
      ['2月', 32],
      ['3月', 70],
      ['4月', 86],
      ['5月', 68.7],
      ['6月', 100.7],
      ['7月', 125.6],
      ['8月', 112.2],
      ['9月', 78.7],
      ['10月', 48.8],
      ['11月', 36.0],
      ['12月', 19.3],
    ],
  },
  xAxis: {
    // 类目轴
    type: 'category',

    // 轴标题
    name: '日期',
    nameLocation: 'center',
    nameRotate: 45,
    nameTextStyle: {
      color: 'red',
      fontSize: 24,
    },

    // 轴线
    axisLine: {
      show: true,
      lineStyle: {
        color: 'green',
        width: 2,
      },
    },

    // 分割线
    splitLine: {
      show: true,
      lineStyle: {
        color: 'blue',
        width: 2,
      },
    },

    // 轴刻度
    axisTick: {
      show: true,
      lineStyle: {
        color: 'red',
        width: 2,
      },
    },

    // 轴刻度标签
    axisLabel: {
      show: true,
      color: 'purple',
      fontSize: 20,
    },
  },
  yAxis: {
    type: 'value',
    name: '降水量',
    min: 0,
    max: 250,
    position: 'right',
    axisLabel: {
      formatter: '{value} ml', // 轴刻度标签格式化
    },
  },
  series: [
    {
      type: 'bar',
    },
  ],
}